

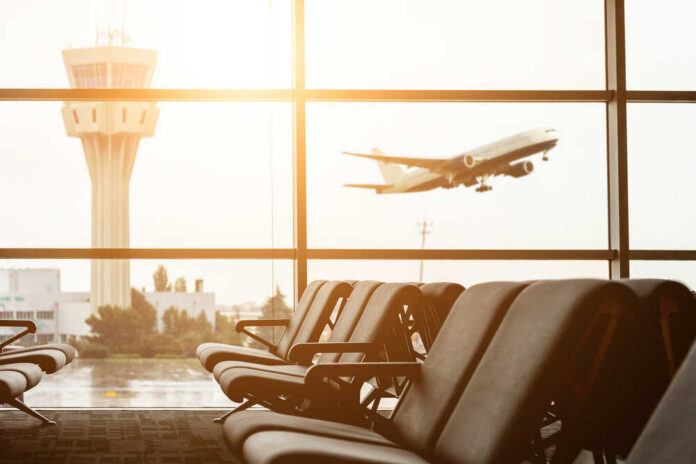
Dallas/Fort Worth International just earned the title no traveler wants to hear: America’s most stressful airport, driven by a nation-leading delay rate and stubborn cancellations in 2025.
At a Glance
- Rightway Parking ranked Dallas/Fort Worth International No. 1 for traveler stress, based on 2025 data.
- Delays hit 27.86% at the airport in 2025, the highest among the airports reviewed.
- Cancellations reached 2.76%, third-highest in the set, compounding the pain.
- Delay rates worsened by 33.67% since 2021, pointing to a trend, not a blip.
What Drove The “Most Stressful” Label
Rightway Parking compared 55 major airports and blended five simple measures: 2025 delay rate, 2025 cancellation rate, change in delay since 2021, and the driving distance and time to downtown. Each factor carried equal weight. Dallas/Fort Worth International ranked first because it posted the highest delay rate at 27.86% and the third-highest cancellation rate at 2.76%. That combination put the airport in the top three for both pain points, a rare double hit in the dataset.
Several outlets repeated the same figures and the same No. 1 ranking. Fox News, CultureMap Dallas, Men’s Journal, Audacy, and USA Today all pointed to the same findings and cited 2025 U.S. Bureau of Transportation Statistics data as the backbone. That broad repeat signals the core stats drove the story, not a lone headline writer. The storyline is clear: many flights ran late, too many were canceled, and the driving link to the metro core didn’t help the overall score.
The Data Behind Delays And Why It Matters
The Bureau of Transportation Statistics uses a simple line: a flight counts on time if it arrives or departs within 15 minutes of schedule. Everything after that is late. That standard shapes every delay rate you see in travel news. It also affects how causes are split. When more than one factor slows a flight, the Bureau of Transportation Statistics and the Federal Aviation Administration prorate the delayed minutes across causes. That method focuses the debate on rates, minutes, and attribution, not anecdotes.
The 33.67% rise in the airport’s delay rate since 2021 makes the ranking bite more. A bad month can fool people. A multi-year jump is harder to shrug off. The equal-weight model also counted drive distance and time to downtown. That does not change whether your plane takes off, but it shapes the total grind of a trip. For a hub that is not the nation’s busiest, leading on stress speaks to more than volume alone.
How To Read A Composite Ranking Without Getting Spun
Travel rankings often mix performance and convenience, then crown a winner or loser. The public reads the headline as pure truth. The method matters. Rightway Parking used five straightforward inputs and split the weight evenly. That is clean and replicable. It is also a choice. A model that doubles the weight on cancellations or drops drive time would shuffle the list. This is not a flaw; it is how scoring systems work in sports, schools, and markets.
DFW really caught a bad headline here. 😅 The study ranked Dallas/Fort Worth as the most stressful of 55 major U.S. airports, citing nearly 28% delayed flights, 2.76% cancellations, rising delays, and the distance from downtown.
That’s a rough combination for any traveler. ✈️😩
— Master Thought (@MasterThousmg) October 8, 2026
Common sense says travelers care about two things first: does my flight leave on time, and does it get canceled? By that lens, this airport’s 2025 record justifies the heat. The Bureau of Transportation Statistics framework also matches everyday experience. Fifteen minutes late feels different from ninety. Prorating delay causes by minutes, rather than guesses, tracks with fairness. That is why these numbers stick. They describe the pain travelers feel, not just a quirk in a spreadsheet.
What Comes Next For Travelers And The Airport
Travelers should pad connection times through the airport until the 2026 data show clear improvement. Nonstop options reduce missed connections when delay rates run hot. Morning departures help since weather and traffic stack up later in the day. Build a backup plan for tight layovers, and avoid the last flight of the night when possible. Simple moves like these lower personal stress, no matter what a national list says this month.
Airport leaders and airline partners have levers. Breakdowns often trace to gate flow, crew timing, runway balance, and weather choke points. The public does not need the blame game; it needs fewer surprises. Publishing a monthly dashboard of delays by cause, plus fixes in motion, would show respect for customers and align with American conservative values of transparency and accountability. Own the problem, show the plan, report the results. That is how you change a headline and rebuild trust.
Sources:
foxnews.com, travelandtourworld.com, fortworth.culturemap.com, yourvalley.net, audacy.com, transtats.bts.gov, oig.dot.gov